NORTH READING ENGINEERING
NORTH READING, MASSACHUSETTS 01864 USA
HERE'S A KLIPSCHORN CROSSOVER NETWORK THAT YOU DAMN WELL BETTER BUILD!
Here's a crossover network design for the Klipschorn that you can build yourself. I'll let you decide if it's a change for the better or not. I've attempted to provide a detailed description, using acoustic response plots, of what the network does to the output of the drivers. I've also provided details on simulating the behavior.
Here's the schematic:
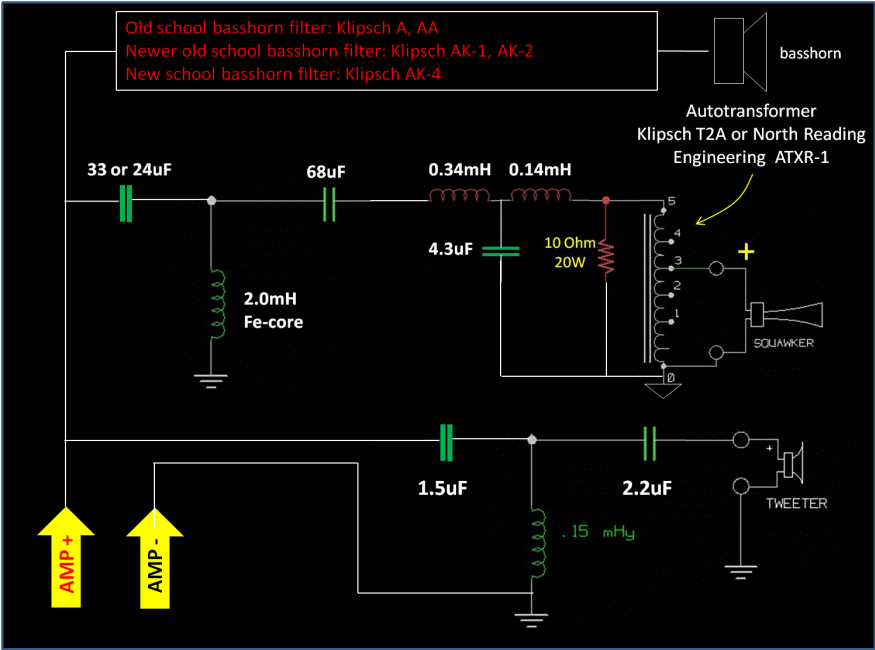
It's really not all that complicated to make and there's some flexibility in the design. Rather
than specifying a filter for the bass horn, I suggest that you experiment
with various configurations listed above until you find one that integrates with the
bass horn you're using. For the Klipschorn, the AA bass filter seems to
work well. If you own any of the crossovers listed, you can build the mid
and tweeter sections and use the bass filter from your existing network.
MEASUREMENTS
Let's start with the midrange (squawker) filter. The filter is designed to reduce the audibility of everything above about 6kHz and everything below about 300Hz. AND it does it without using 20 pounds of copper inductors and a dozen or so capacitors. How the filter effects the midrange output is shown in the graph below where three plots are super-imposed (the green plot is the noise floor). Here, there's no attempt to baffle you with bullshit by posting plots of predictions obtained from a circuit simulation package (I'll provide them below however) or worse, plots showing the electrical response of the an actual crossover loaded with some nonsensical "equivalent circuit" load substituting as a Klipschorn bass horn. The design goals in this network are stated and then substantiated by acoustic responses measured using an Earthworks M23 High Definition measurement microphone and a 24-bit acoustic analyzer with sampling rates as high a 196kHz.
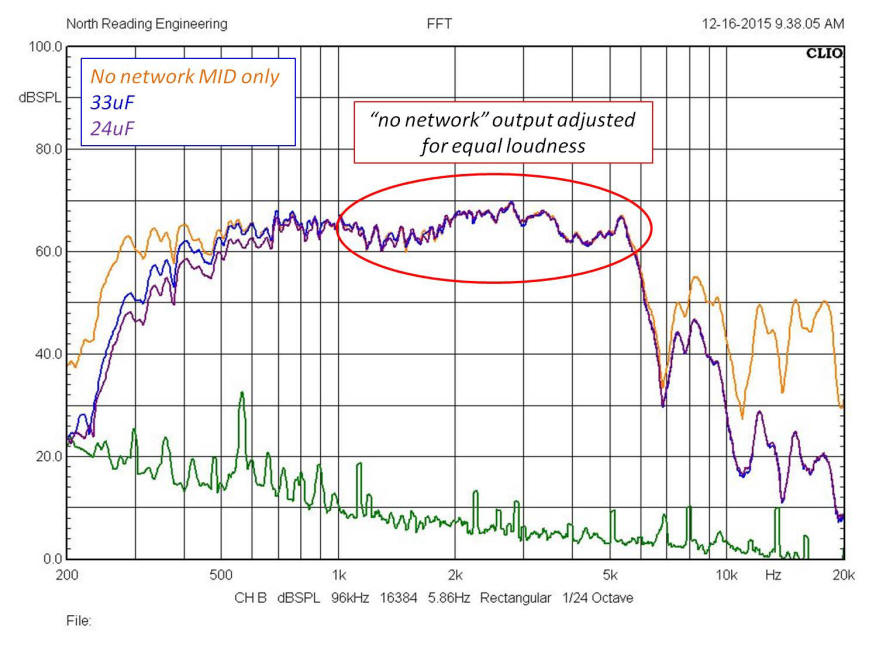
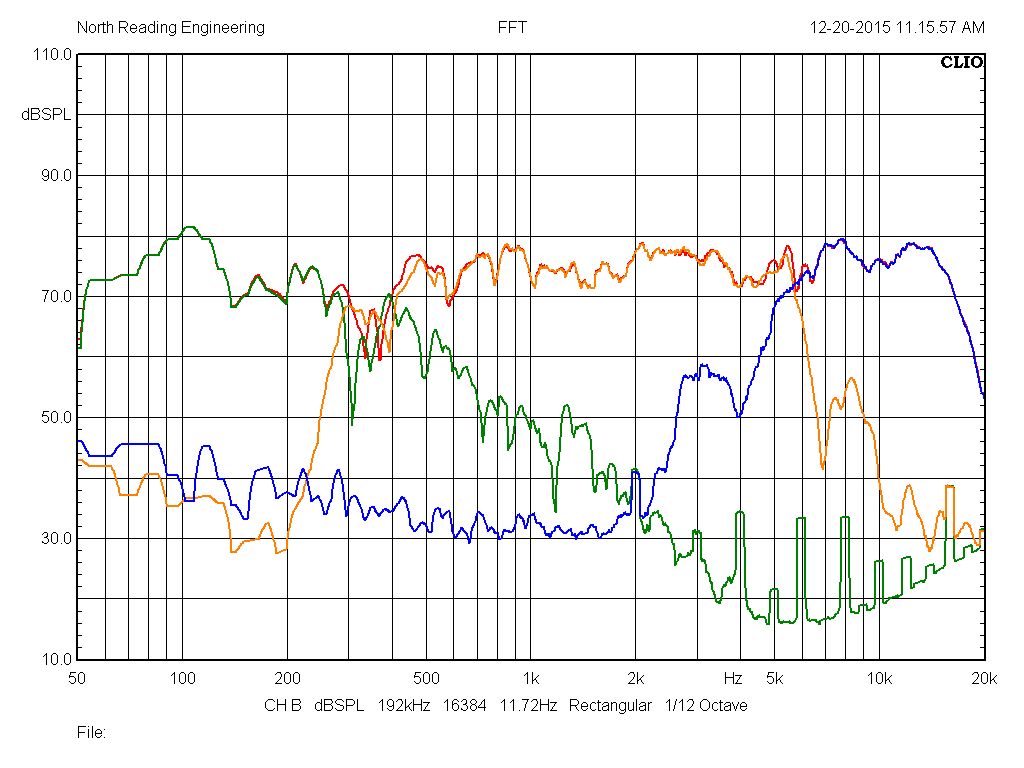
Above, the gold plot is the Klipsch midrange
(K401+K55M) with no network running "raw", the purple plot
is the midrange on the network with the 24uF cap and the blue plot is the
network with the 33uF cap. Without the autotransformer, the raw response
of the midrange is louder than than a driver attached to the network
so, to make the comparison a bit easier, the amplifier power was lowered when
making the raw response measurements thus allowing for a direct comparison as
shown above. As is evident in the raw response, the horn
assembly has a "hard" upper and lower limit, independent of any network
attached. With the 33uF network however, the response begins to attenuate
below about 500Hz. Replacing the 33uF by the 24uF provides for more
attenuation below 500Hz, a design modification that might be preferable for say,
a LaScala or Belle bass horn. Note the attenuation of the response below 300Hz
drops by 30dB(!) for an effective attenuation rate of nearly 60dB/octave
between 300 and 200Hz! In fact, the 200Hz response is nearly 40dB down
with respect to the output at 500Hz.Turning attention to the higher frequency range
in the graph above, notice the response above about 5kHz, very rough indeed.
Note also, the network shuts down, quite
effectively, the output above 7kHz (compare purple to gold plot). Why this
helps is shown below.
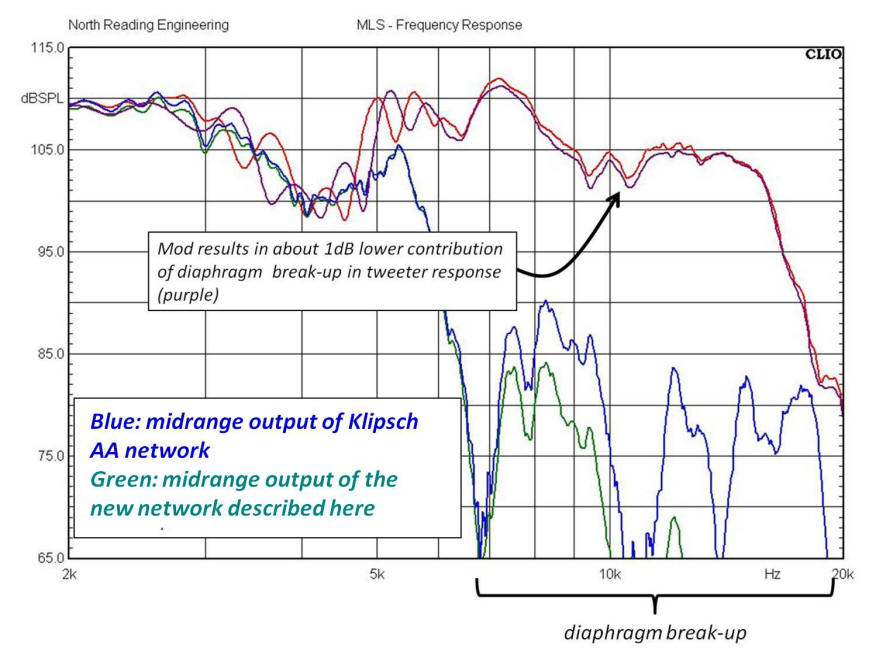
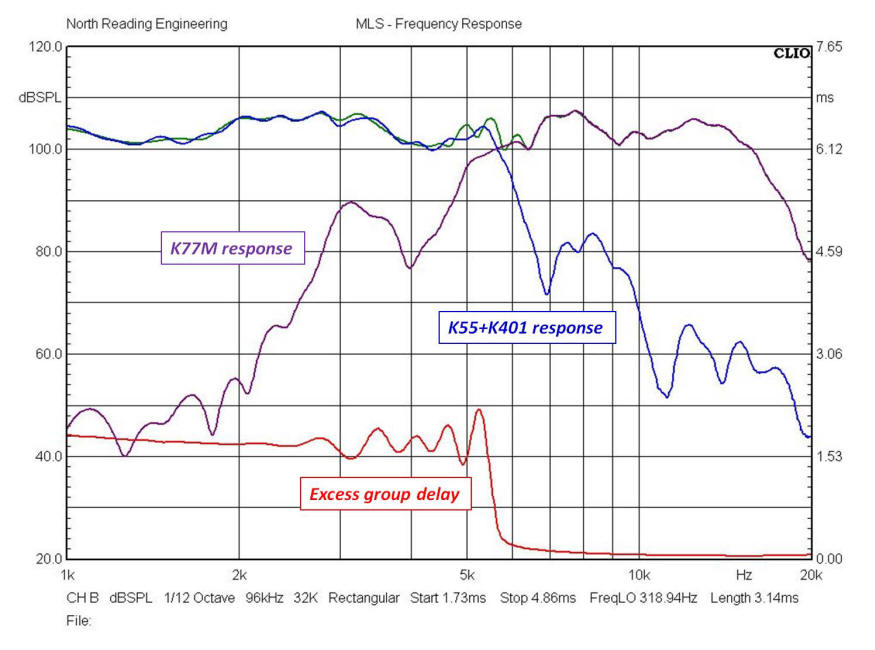
The red plot in the above graph is the frequency response of the midrange and K77M tweeter operating with the Klipsch factory AA
network. The blue plot is the AA midrange response with the tweeter
unplugged. As seen in the green plot, the new net lowers the output of the midrange in
the diaphragm break-up region. Since the sound contribution coming from the midrange in this region is just noise,
lowering the output is a good thing. The result is to lower, by about 1dB, the output measured in the combined
response (purple). Also, going something called an "extreme slope network"
is unnecessary. Save your money, the benefits associated with steep slope
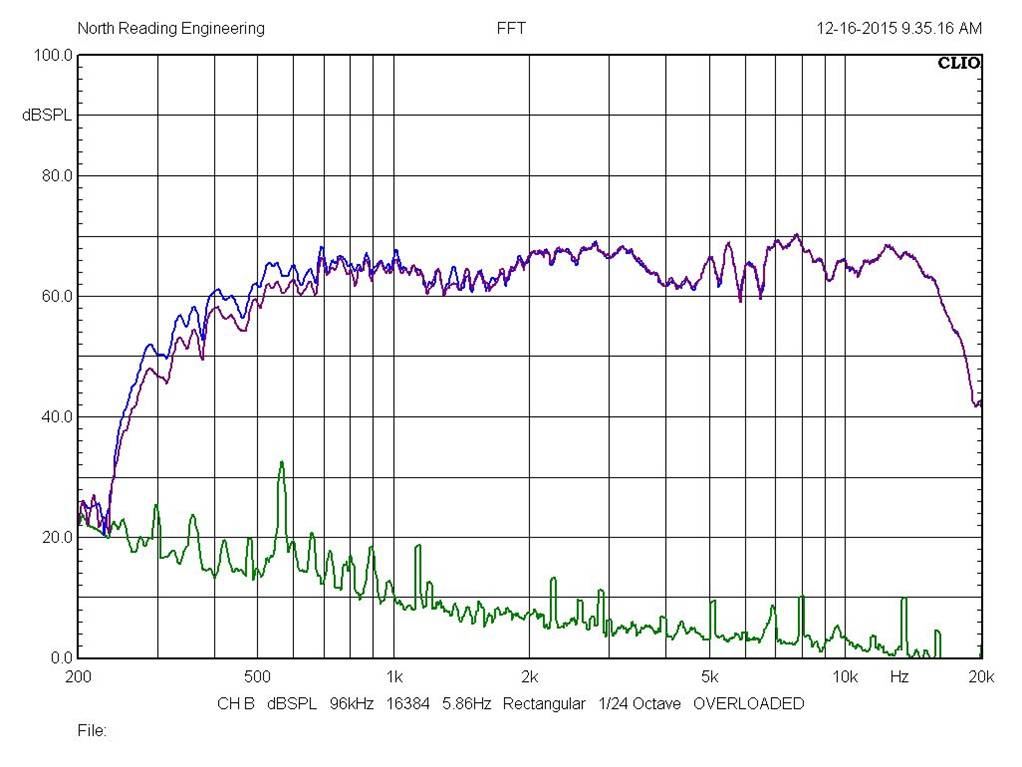
transition band attenuation rates are realized in this design. The plots below are the responses of the
33uF (blue) and 24uF (purple) midrange networks tweeter and
crossover operating into a Klipschorn top section. The green plot is the noise floor. The microphone is about
4' from the mouth of the midrange horn
and is on-axis with it. As is evident in the plot, the responses are within
a 10dB window between 500 and 16,000Hz.
The plot below is the network operating with a 4.0mH series inductor on the Klipschorn bass unit. Red plot is the system response. Adding a 100uF capacitor across the bass horn terminals, in conjunction with the 4.0mH inductor, will "boost" the output of the bass horn a bit between 300-400Hz.
A closer look at the crossover region is possible using cross-correlated MLS
test signals and impulse response gating. A high resolution,
quasi-anechoic (reflection free) response is shown below. The microphone is about 4' from
the top-section baffle, on-axis of midrange horn mouth. The physical
distances between the midrange and tweeter voice coils account, to a large
extent, for the 1.7ms shift seen the excess group delay.
The builder can alter the output of the tweeter in the crossover region by
changing the value of the 1.5uF capacitor. A value lower, say 1.2uF, will
reduce the output a bit whilst a higher value, say 2.2uF will make it a bit
brighter.
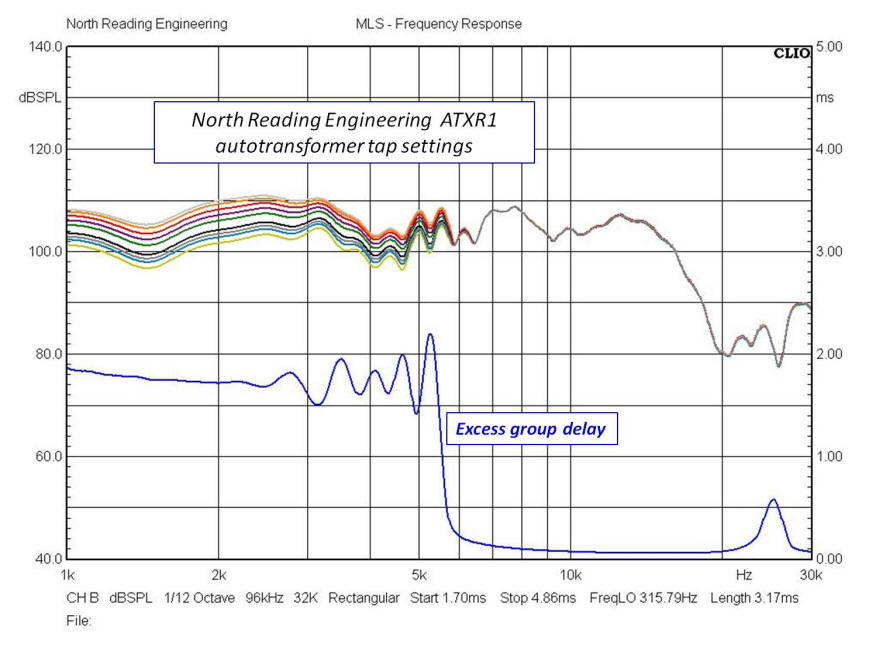
The effect of changing taps using the North Reading Engineering ATXR-1
autotransformer is shown below. The autotransformer allows for about 0.7dB
changes in the midrange output. The measurement setup is the same as
above. If you intended to make changes to the output level of the
midrange, the ATXR-1 is the autotransformer to use. Note that there are
additional sound pressure levels not shown (analyzer is limited to 9 responses
on one graph).
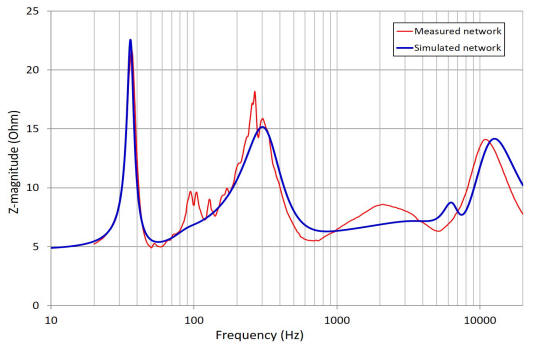
Referring the busy graph below, I've plotted the impedance magnitude of the raw
Klipschorn bass unit (green), the Klipschorn bass unit in series with a 4.0mH
inductor (purple), the same plus the midrange horn assembly and network (blue)
and finally, the complete 3-way system (red).
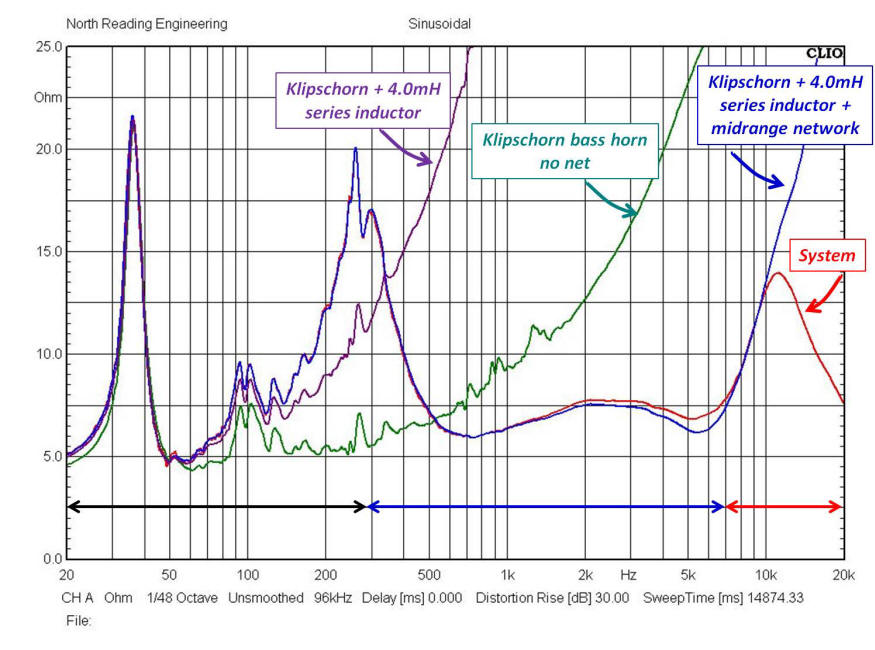
The effect of the shunt resistor is seen between 500-5000Hz where the impedance
fluctuates between 7-8 ohms. The minimum system impedance, 4.5 ohms
in magnitude, occurs between 50-60Hz and is consistent with the value the late
Richard C. Heyser noted (55Hz) in the November 1986 Audio Magazine review of the
Klipschorn (Equipment Profile section). Regarding impedance presented to
the amplifier, recall what Heyser had to say about the impedance of the stock Klipschorn, excised
from the same article:
So, based on the quote above, it seems as
though Mr. Heyser thought little of the Klipschorn
complex impedance and it's effect on amplifier performance as long as the power
amplifier can drive 4 ohms. From the consumers perspective, a relatively
straightforward requirement to fulfill.
To predict how a crossover network will change the impedance of a speaker
system, a model termed the "equivalent circuit" of
the speaker load is required. The equivalent circuit is used to simulate the
load presented to the network
connected to it. The network component values (capacitors, inductors and resistors)
are then optimized based on the simulations. Simulations can, for example,
output the voltage across the speaker terminals as a function of frequency.
Plots of voltage as a function of logarithmic frequency are plotted and assessed
initially for pass-band linearity, shelving, phasing errors, transition
band attenuation rates and so on. Actual acoustic measurements
are then taken with the loudspeaker system connected to the network and the
frequency response measured. Revisions to the design are then made in the simulator and
the acoustic measurements are repeated. The process continues until the
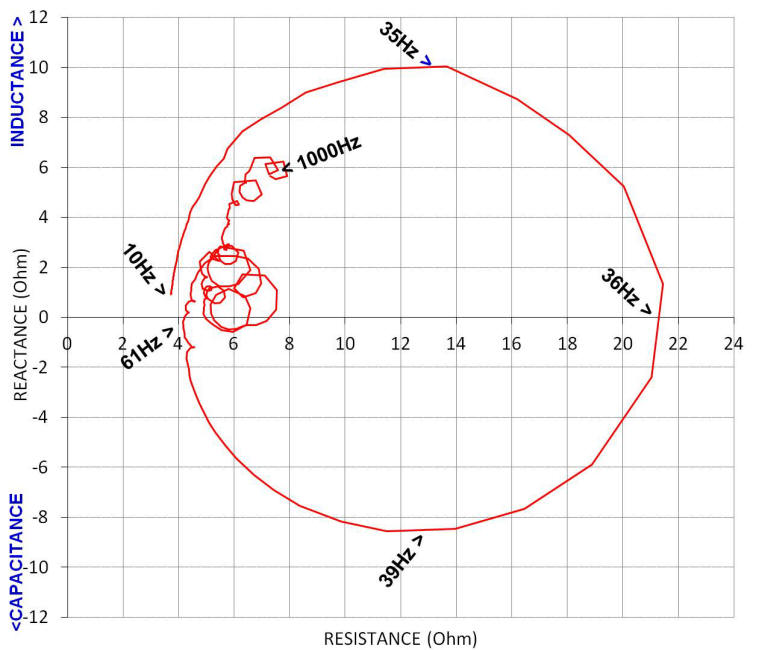
desired performance is obtained.To develop the equivalent
electrical circuit of the Klipschorn bass unit for example, it's
useful to first obtain its complex impedance plot. The plot below is a
complex impedance of the Klipschorn bass unit (S/N 18W290, sq. magnet K33E
woofer) located in a corner position with no network attached. The plot
covers the
frequency range from 10 to 1000Hz. The Z-complex of the simulated load
will then be compared to the empirical result.
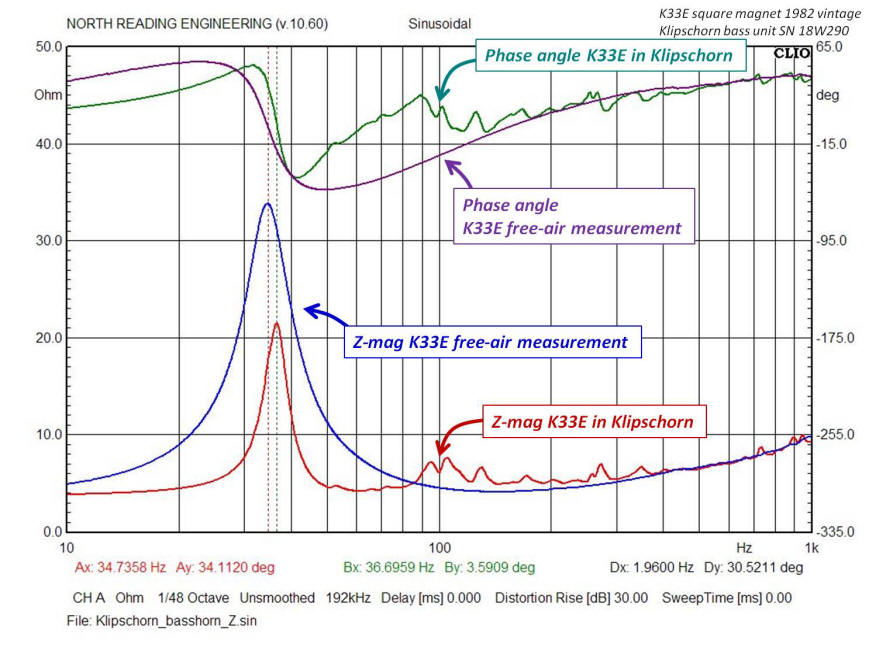
To a first approximation, the complex impedance of the Klipschorn bass unit can
be modeled by first measuring the free-air, complex
impedance of the K33E woofer and then measuring it installed in the bass horn.
The difference in the two measurements is then attributed to the influence of
the horn load on the K33E cone. Elements to the woofer equivalent electrical circuit are then
added to
account for the differences. The plot below is the data collected for the
analysis and shows how the response of the K33E is altered when operating in the
Klipschorn.
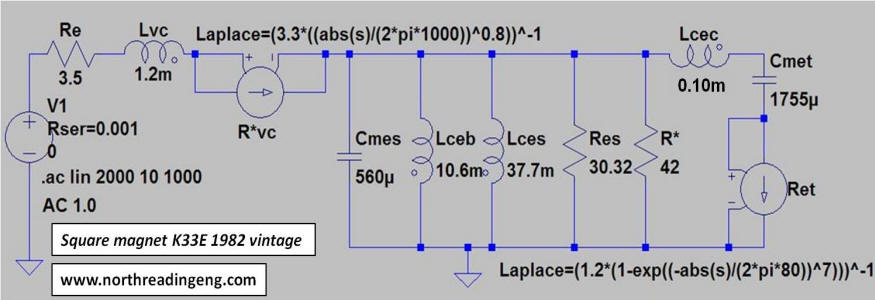
The equivalent electrical circuit for the K33E installed in the
Klipschorn folded bass horn has been developed
here and shown below.
The circuit, when executed in SPICE, yields an accurate simulation of the
complex impedance of the driver mounted in the bass horn. Thus, with
an accurate network simulator for the basshorn and autotransformer the
magnitude response of the filter design can predicted before committing the
design to hardware.
SIMULATIONS
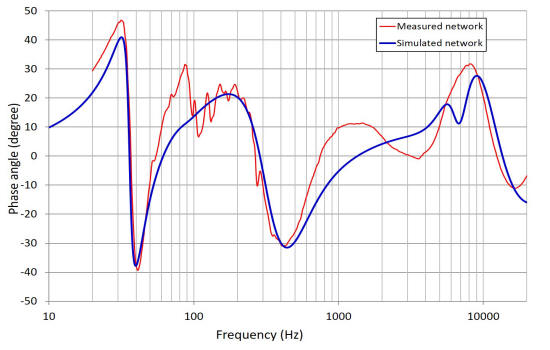
The graphs below are the measured (red) frequency dependent Z-magnitude and phase angles of the the new net connected to the three system drivers. The simulations (blue) are superimposed of the actual data. In the simulation, I added a couple of resistors here and there (for a total of 2 or 3 Ohms) to simulate the patch cord resistances present in the measurement of the proto-build. The model of the autotransformer simulates a -6dB tap setting, in the measurement the midrange was on a somewhat lower tap setting (I noticed this after plotting the two to make the graph!). A 4.0mH series inductor is used as the bass horn filter. Some deviations are observed between the simulation and measured responses but, for purposes of this brief, I consider the model as a reasonable predictor of the electrical behavior of the network.
The graphs below are the measured (red) frequency dependent Z-magnitude and phase angles of the the new net connected to the three system drivers. The simulations (blue) are superimposed of the actual data. In the simulation, I added a couple of resistors here and there (for a total of 2 or 3 Ohms) to simulate the patch cord resistances present in the measurement of the proto-build. The model of the autotransformer simulates a -6dB tap setting, in the measurement the midrange was on a somewhat lower tap setting (I noticed this after plotting the two to make the graph!). A 4.0mH series inductor is used as the bass horn filter. Some deviations are observed between the simulation and measured responses but, for purposes of this brief, I consider the model as a reasonable predictor of the electrical behavior of the network.
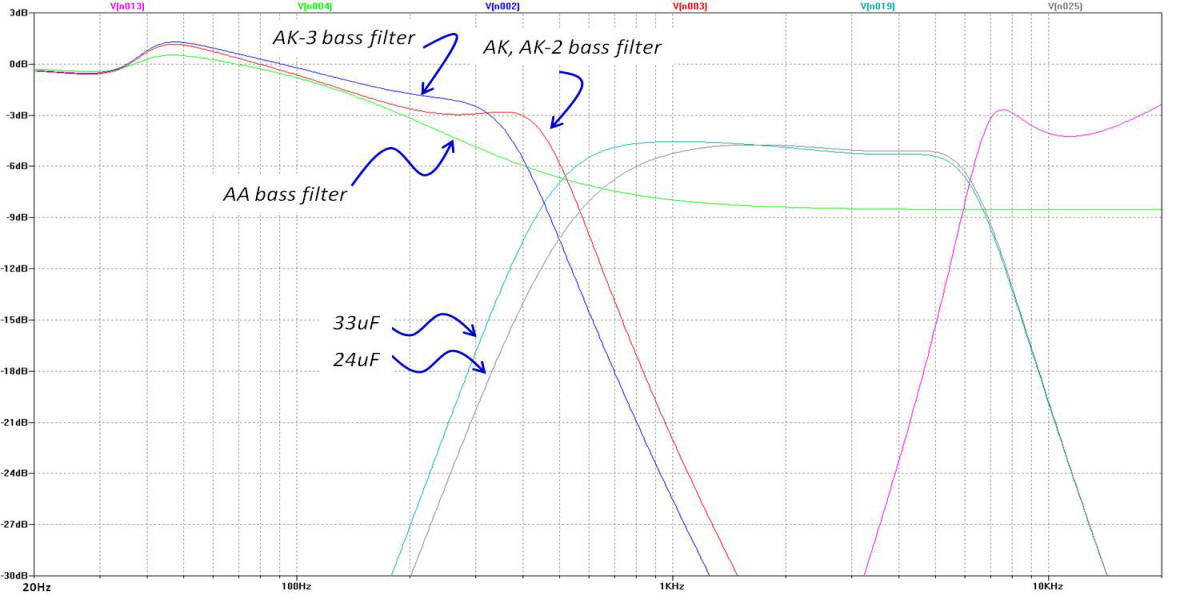
Below is the simulated electrical behavior of the
network measured across the terminals of each driver. The voltage response
is expressed in terms of an equivalent dB. The Klipsch bass filter responses
are also shown. The plots provide some idea as to what each bass filter
does to the response. Note that the actual acoustic response of the bass
horn at 1000Hz is about 30dB down from its peak regardless of the network used
on it. What's important to realize here is that the simulated
response is a "tool" to obtain the actual, desired acoustic response. The
simulations shown below are the result of modifications to the original network
design. In other words, the acoustic responses above were
realized by making modifications to the network that resulted in the simulated response below.
The process consists of iteration between acoustic response, listening tests and
the simulator. The final judgment is always the listening test and for
midranges horns, I use recordings of male and female vocals.
For example, based on listening to the network, the peak in the tweeter
response between 7-8kHz improved the off-axis high frequency response. As
a result, I decided to keep it in the design.
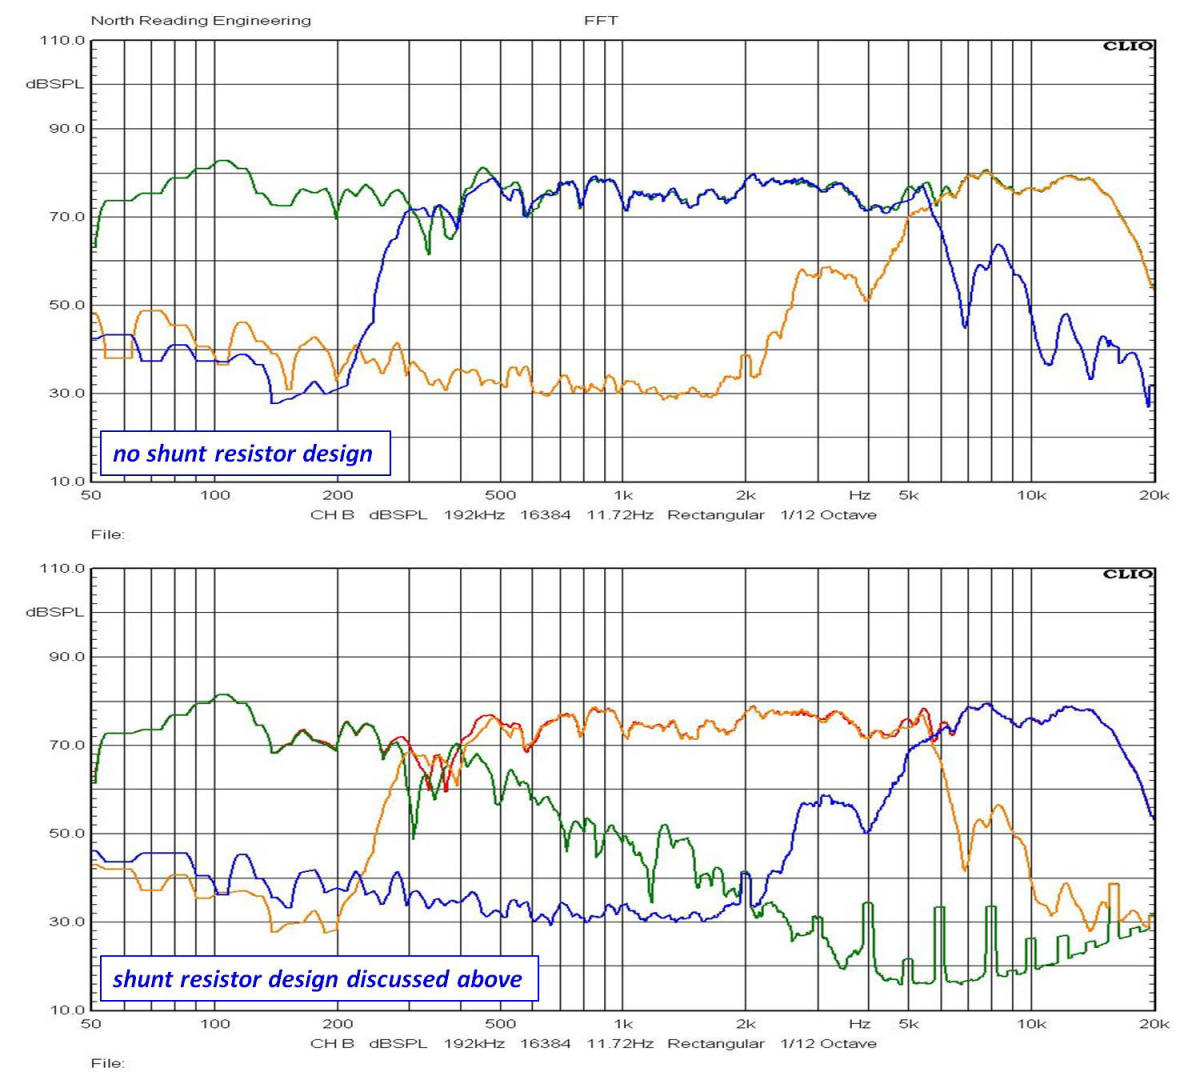
ALTERNATE DESIGNS AND IMPROVEMENTS
In addition to the network design discussed above, I considered the approach taken by Klipsch in the early days and used the autotransformer without a shunting resistor across the input side. The network topology is similar to the design above but the component values are, of course, different. A comparison between the two designs is shown below.
In addition to the network design discussed above, I considered the approach taken by Klipsch in the early days and used the autotransformer without a shunting resistor across the input side. The network topology is similar to the design above but the component values are, of course, different. A comparison between the two designs is shown below.
If you would like to have a pair of the shunt resistor
design networks built
for you, please contact me at the email link provide below.
CONTACT NORTH READING ENGINEERING
REFERENCES
1. R. Small, Direct-Radiator Loudspeaker System Analysis, IEEE Transactions on Audio and Electroacoustics, VOL. AU-19, pp. 269-281, 1971
Website and contents property of John Warren of North Reading Engineering, North Reading, MA 01864 USA. No part of the above may be copied and published, in part or in total, without permission.
© 2017 John Warren